Information visualized
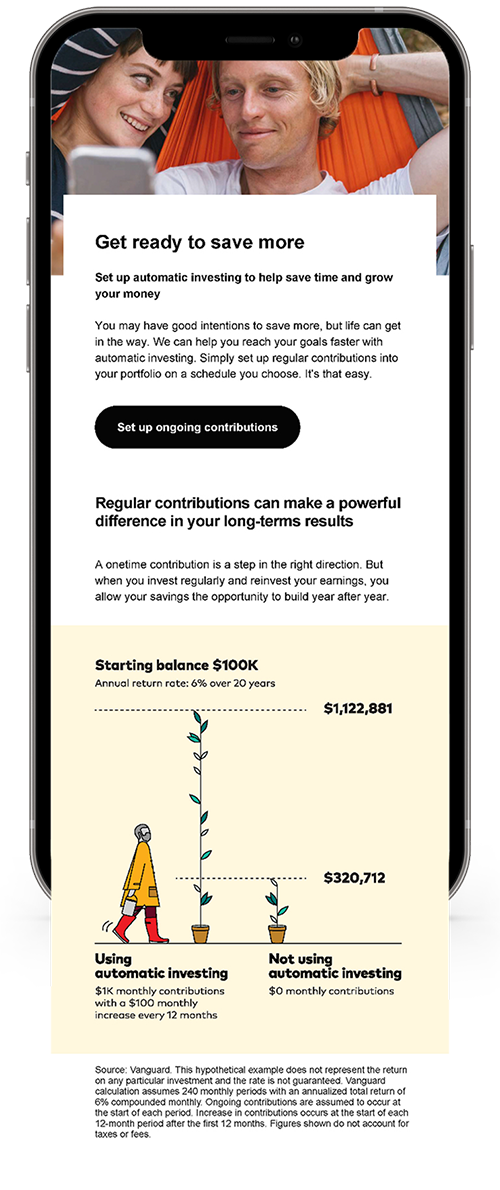
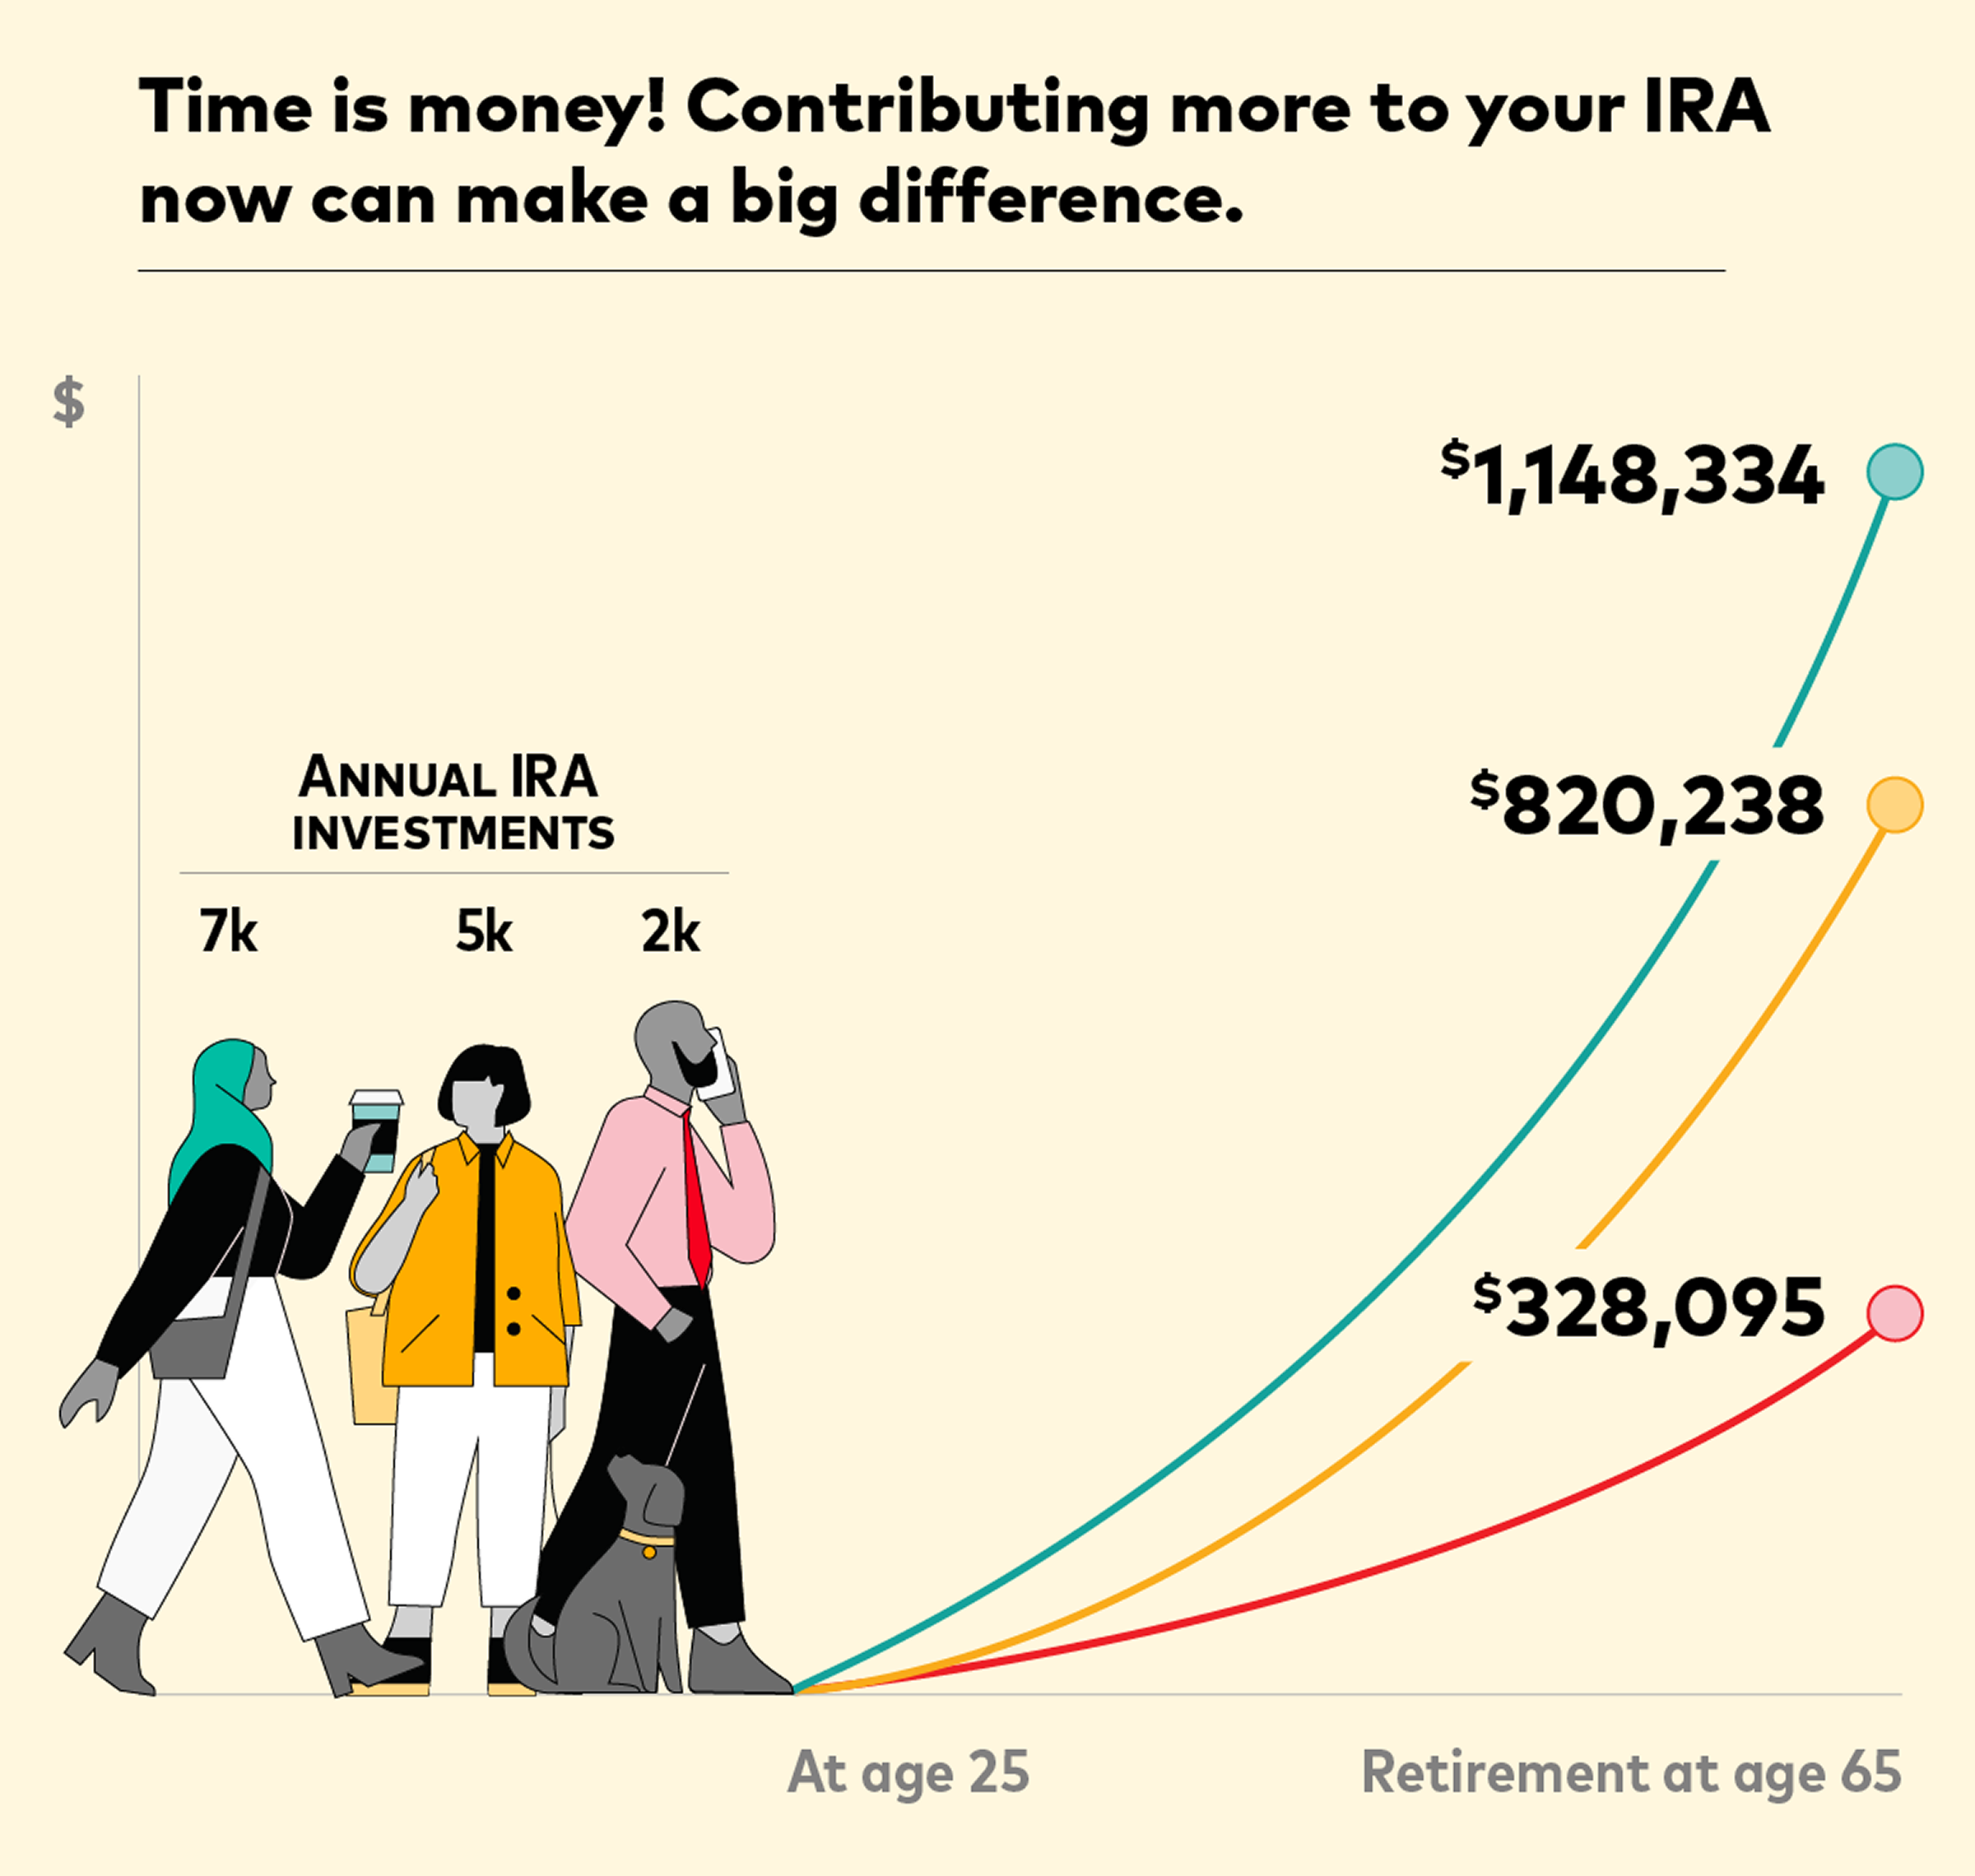
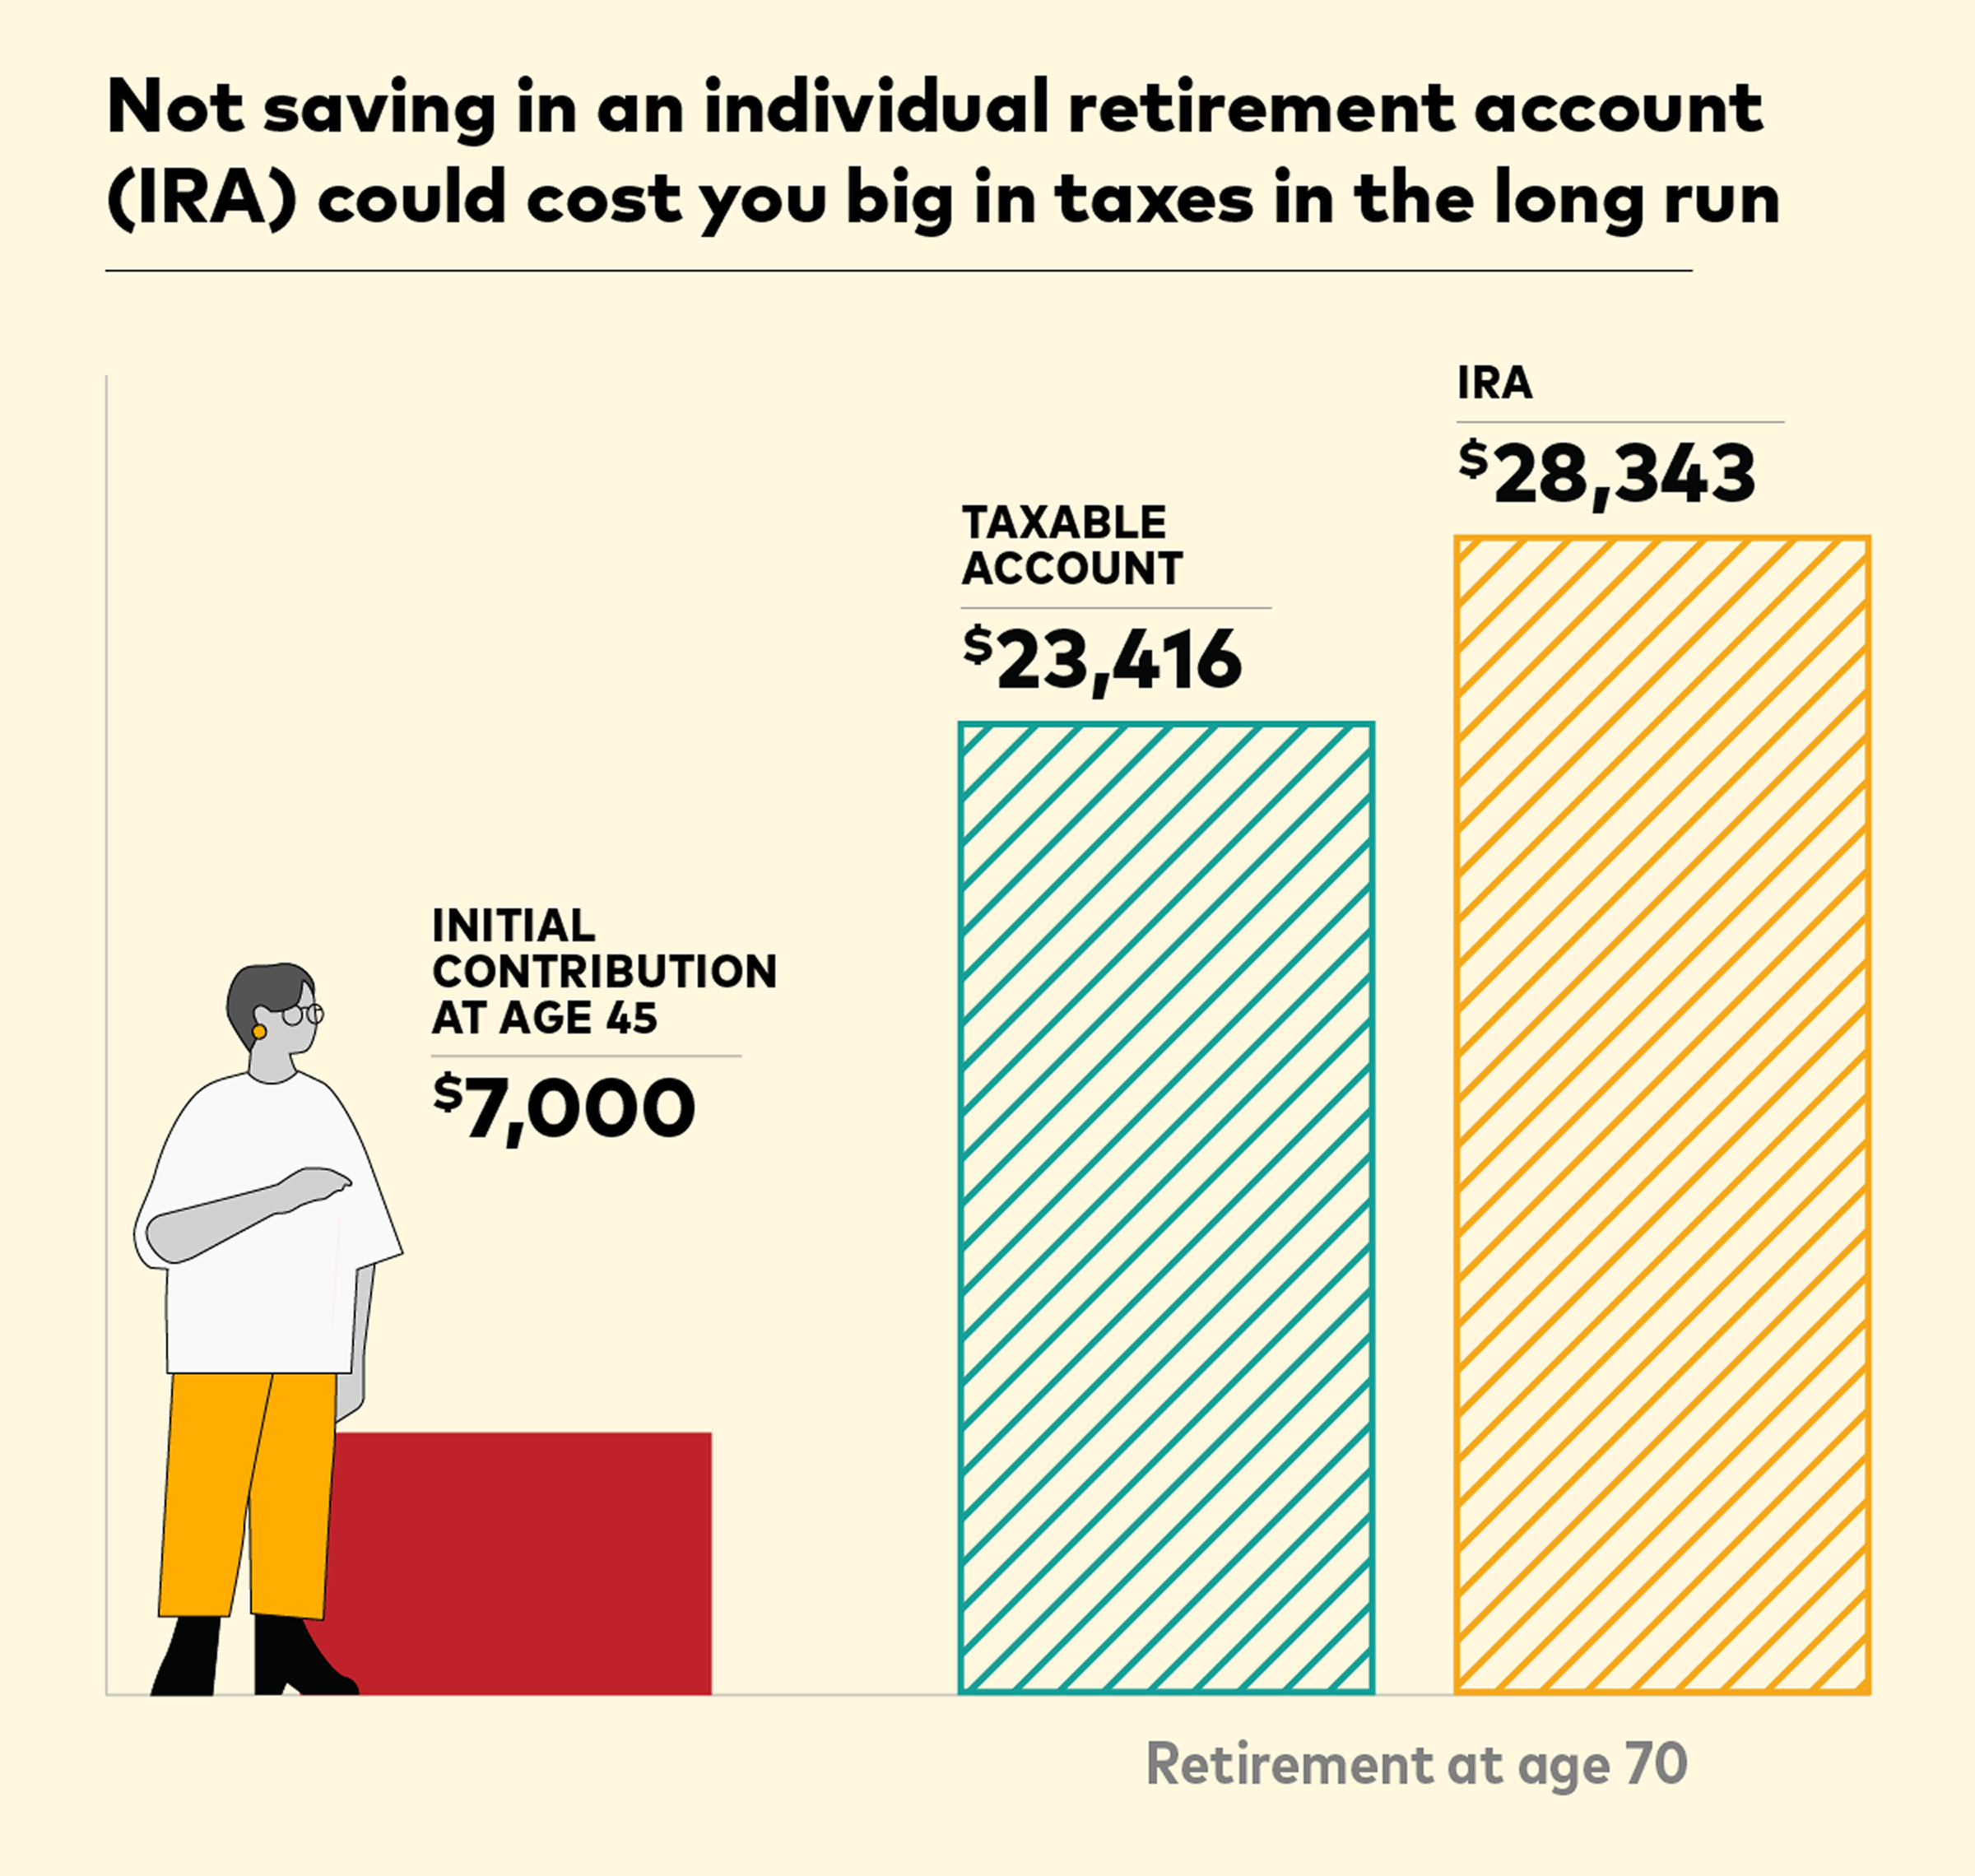
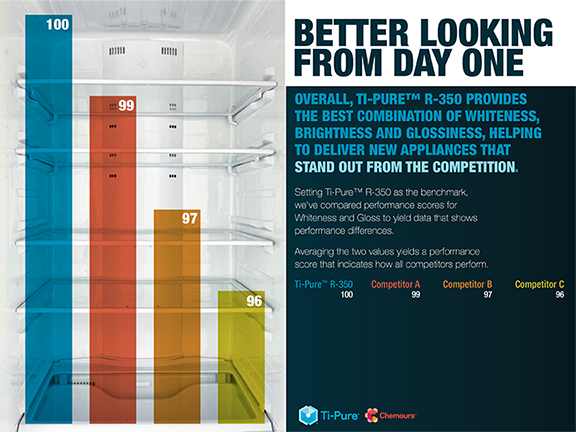
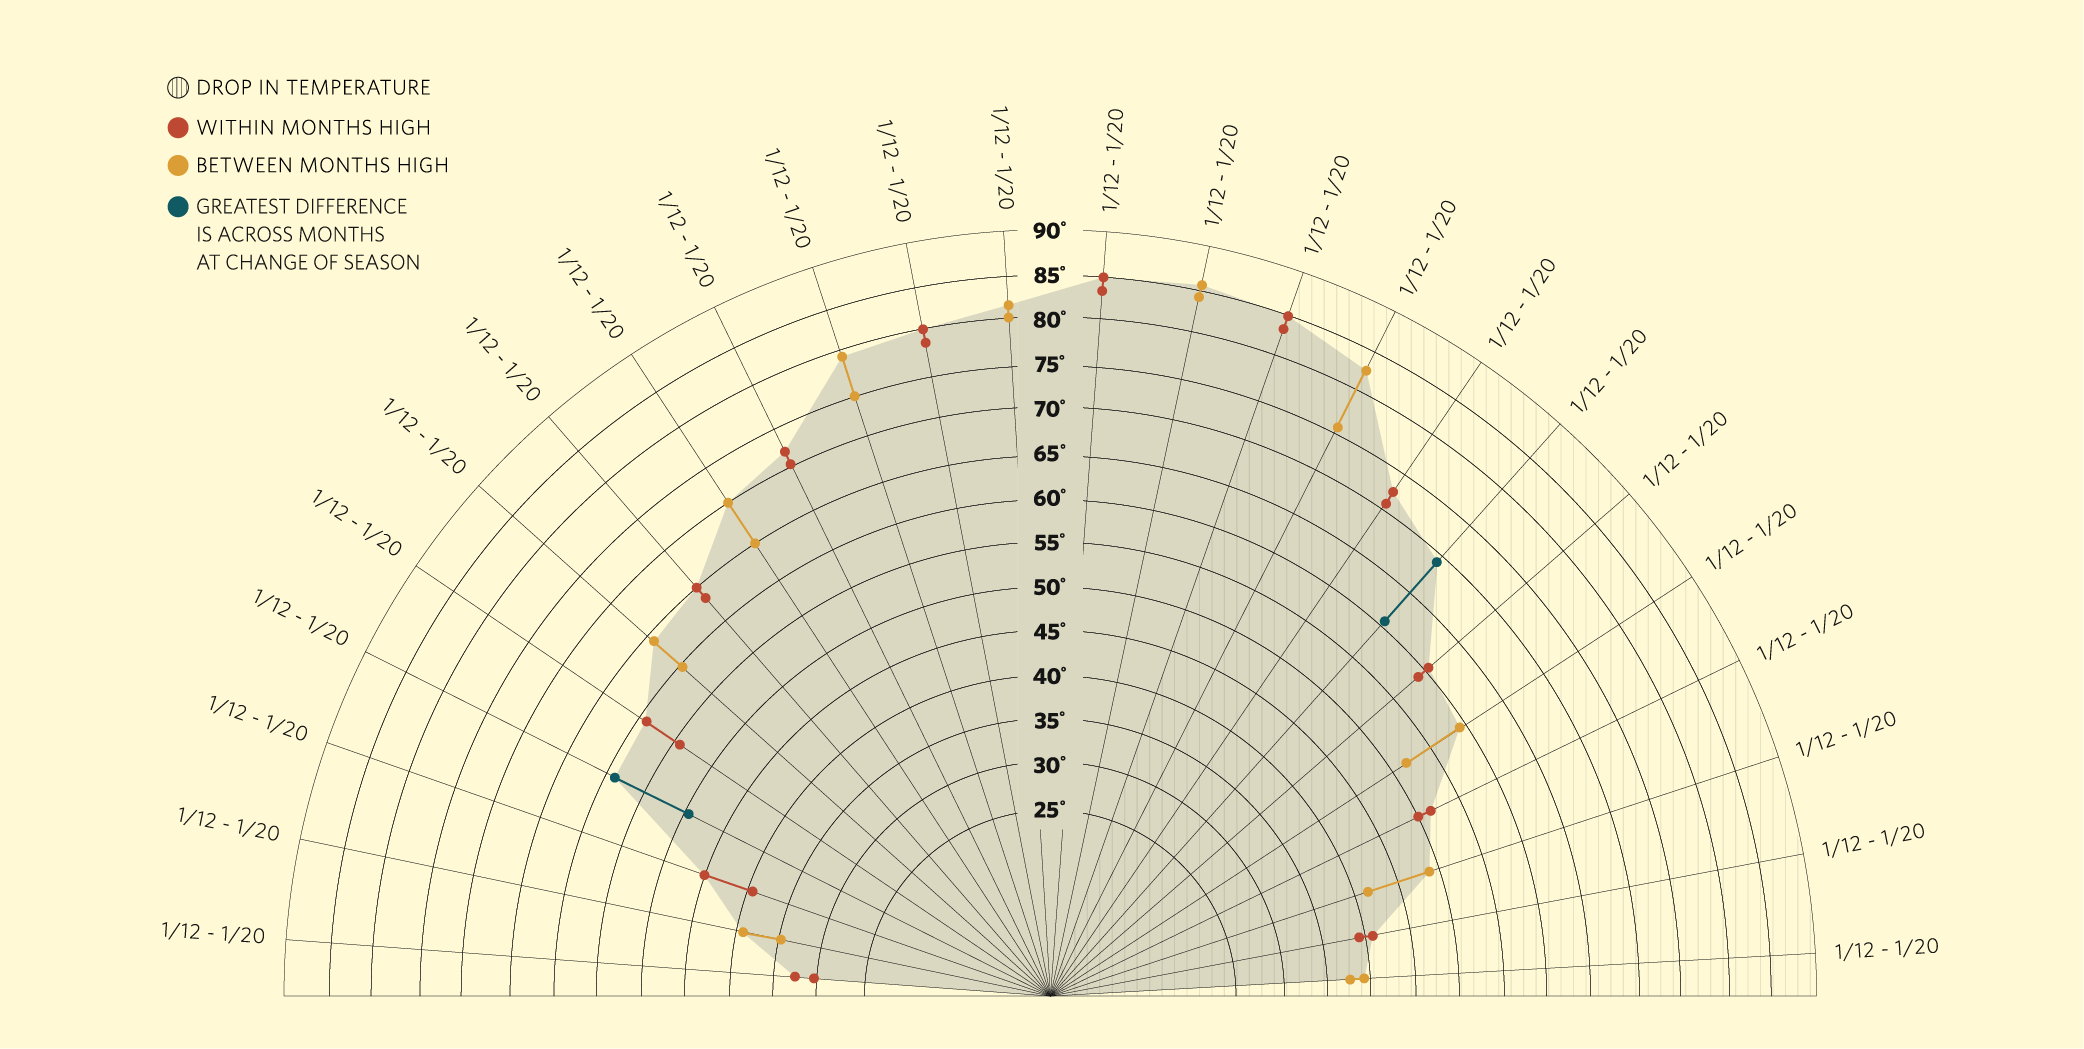
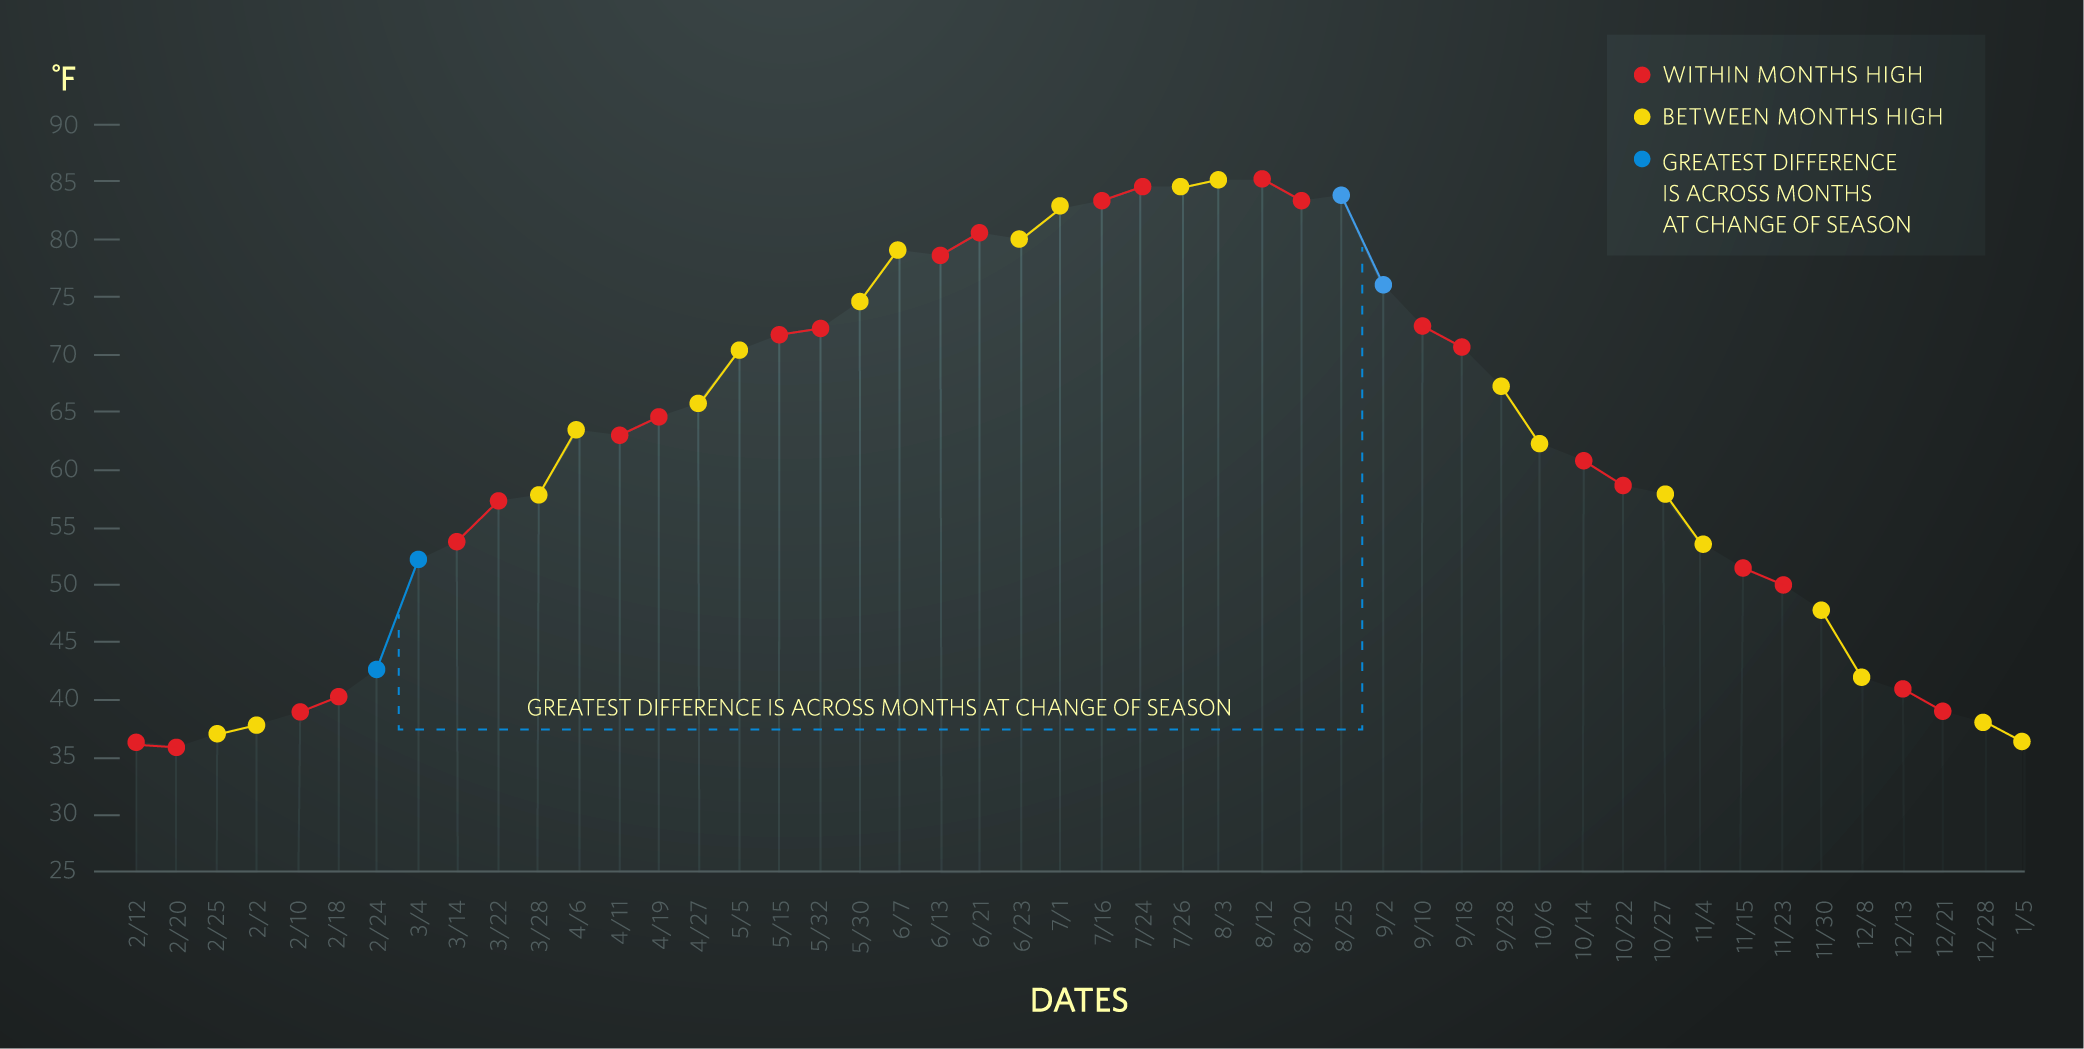
These data visualizations were created for a campaign promoting automatic investing where the target demographic prefers a set it and forget it approach. To increase chances of success, measured by client adoption, I wanted to create an easy way to digest the difference made by enrolling in the program .
At the end of this and a few other campaigns running the same or similar content enrollment increased by 32%.